
Malesuada amet neque diam arcu. Mauris pharetra eu ornare lorem porta nibh condimentum pellentesque.
Triton Digital has released its monthly digital audio Top 20 Ranker for January 2016. El ranker es un listado de las cadenas y estaciones de radio digital de mejor desempeño según los datos de la plataforma de métricas de audiencia Webcast Metrics®.
Total Listening for All Measured Clients
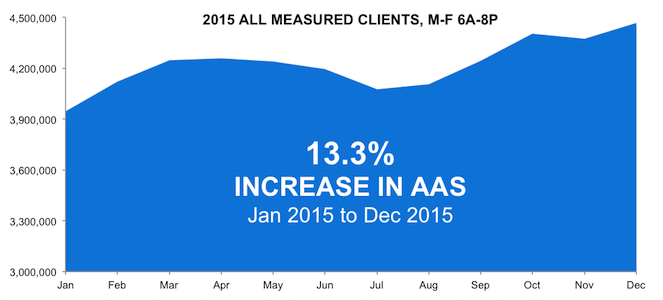
All measured clients within the Domestic U.S. reported a total of 4 493 745,00 Average Active Sessions (AAS) during the Monday-Friday 6:00AM-8:00PM daypart, and 3 693 236,00 AAS during the Monday-Sunday 6:00AM-Midnight daypart.
Taking a Closer Look
Overall streaming has seen steady growth when compared to January 2015. January 2016 Average Active Sessions (AAS) increased by 14,00 percent in the Domestic M-F 6A-8P daypart and by 11,30 percent in the Domestic M-SU 6A-Midnight daypart.
Top Formats
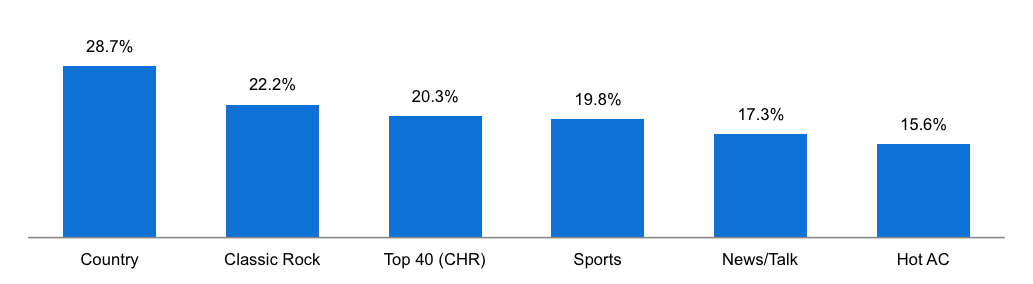
When compared to December 2015, the Country format showed the largest listening gain with a 28,70 percent increase in AAS, followed by Classic Rock (22,20 percent), Top 40 CHR (20,30 percent), Sports (19,80 percent), News/Talk (17,30 percent), and Hot AC (15,60 percent). Many of these formats had changed to the Holiday format in December.
(M-F 6A-8P)
Top Markets
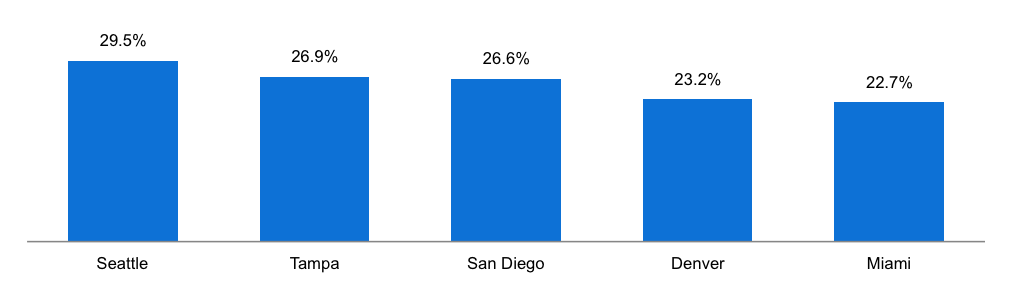
Looking at the top 20 markets, Seattle showed the largest listening gain from December 2015 with a 29,50 percent increase in AAS, followed by Tampa (26,90 percent), San Diego (26,60 percent), Denver (23,20 percent), and Miami (22,70 percent).
(M-F 6A-8P)
Top Devices
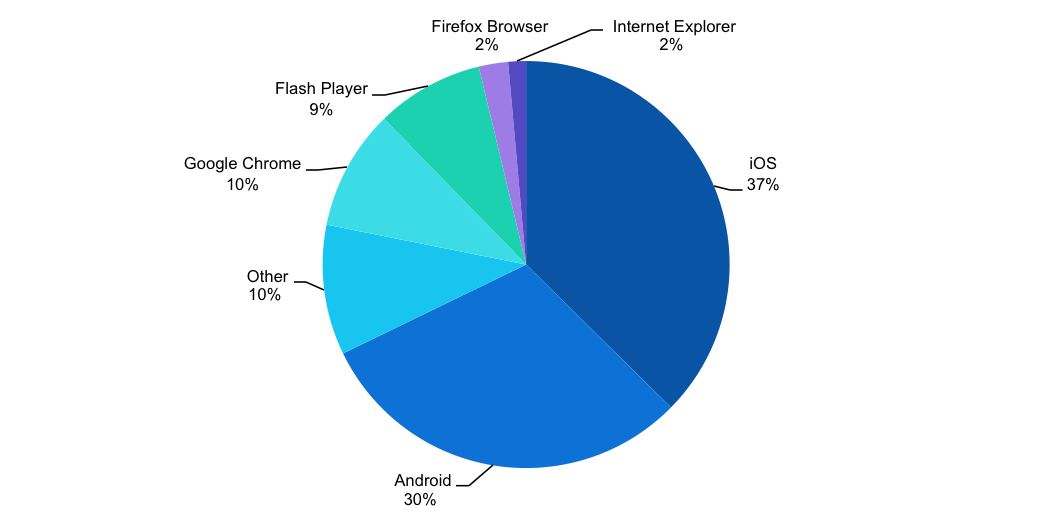
37 percent of listening taking place on an iOS device, followed by Android (30 percent) and Google Chrome (10 percent).
(M-F 6A-8P)
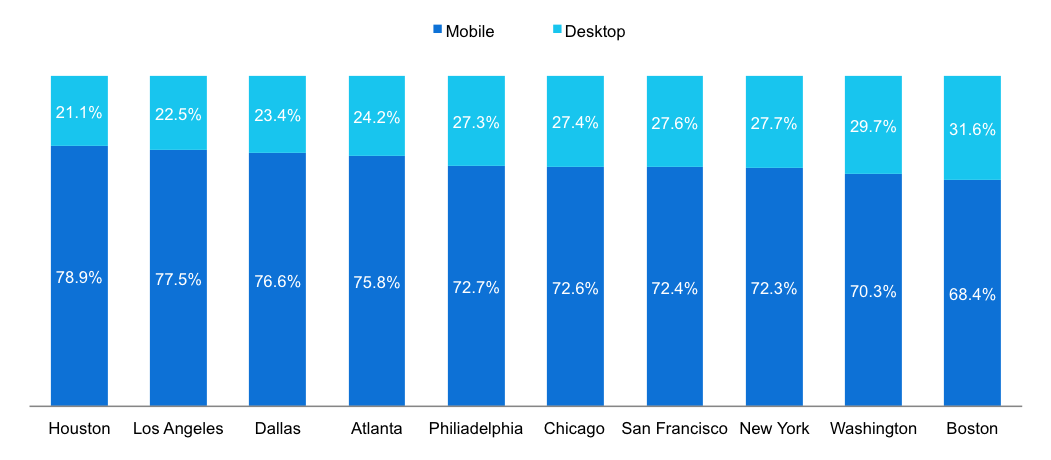
Top 10 Markets by Listening Device
The following chart shows the top 10 markets by AAS broken out by listening device.
(M-F 6A-8P)
Listening by Hour
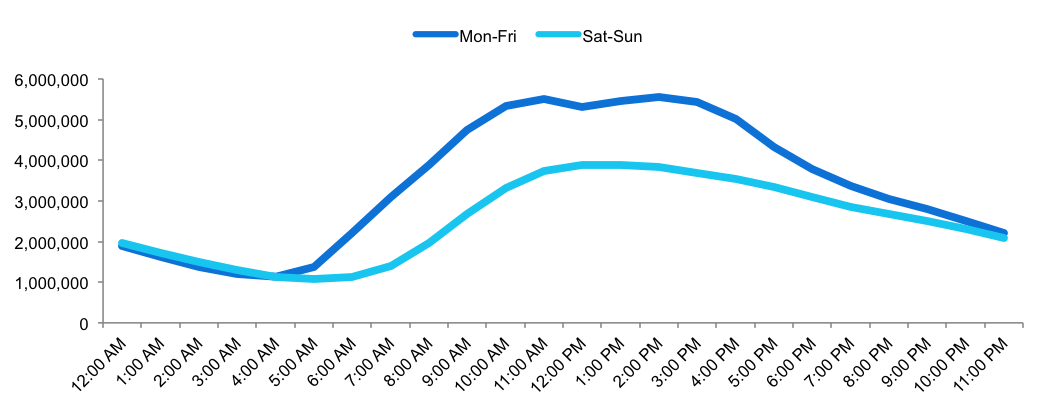
The following chart shows hourly listening by AAS broken out by weekday and weekend.
(M-F 6A-8P)
¿Está listo para desbloquear nuevos ingresos y simplificar la compra de anuncios?
Contáctenos