
Publisher, Advertiser, Insights, 2017
Malesuada amet neque diam arcu. Mauris pharetra eu ornare lorem porta nibh condimentum pellentesque.

Triton Digital has released its monthly digital audio Top 20 Ranker for August 2017. The Ranker is a listing of the top-performing digital audio stations and networks measured by the Webcast Metrics audience measurement platform. A review of the July data uncovered several interesting insights on the U.S. digital audio landscape, shared below.
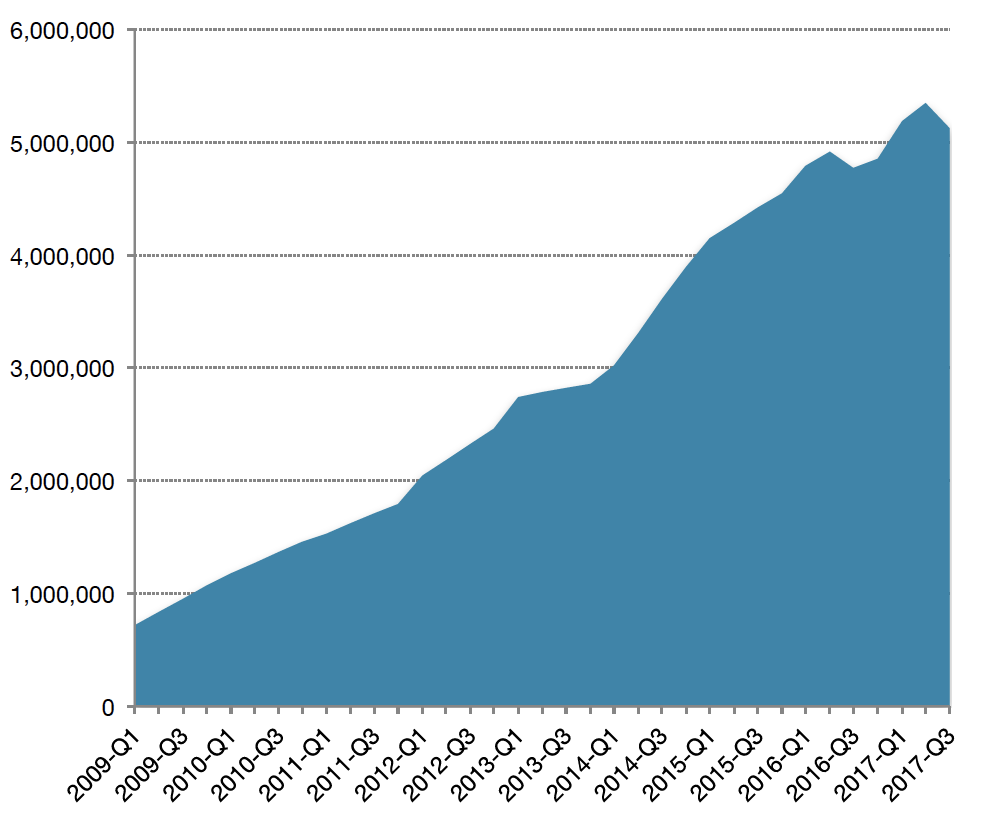
La audiencia total en días de semana se mantiene estable en 5,30 millones en EE. UU.
Todos los clientes medidos en EE. UU. informaron un total de 5 319 918,00 de promedio de sesiones activas (ASS, por su sigla en inglés) durante el período de lunes a viernes de 6:00 a.m. a 8:00 p.m. y 4 543 128,00 en el período de lunes a domingos de 6:00 a.m. hasta la medianoche.
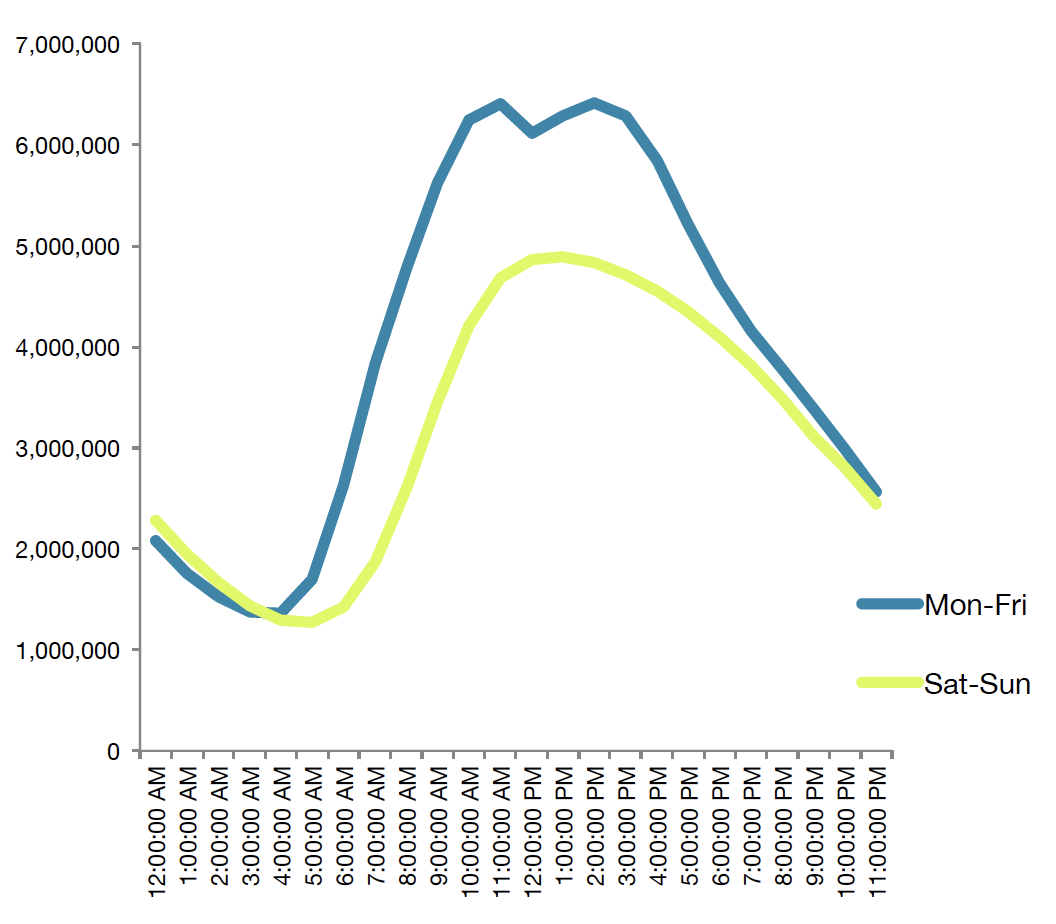
Weekday listening shows highest peak at 2:00 pm
Midweek listening shows peak AAS occurring at 2:00pm in August 2017. Durante el fin de semana, la audiencia alcanza el pico a las 1:00 p.m. para luego caer paulatinamente durante la tarde.
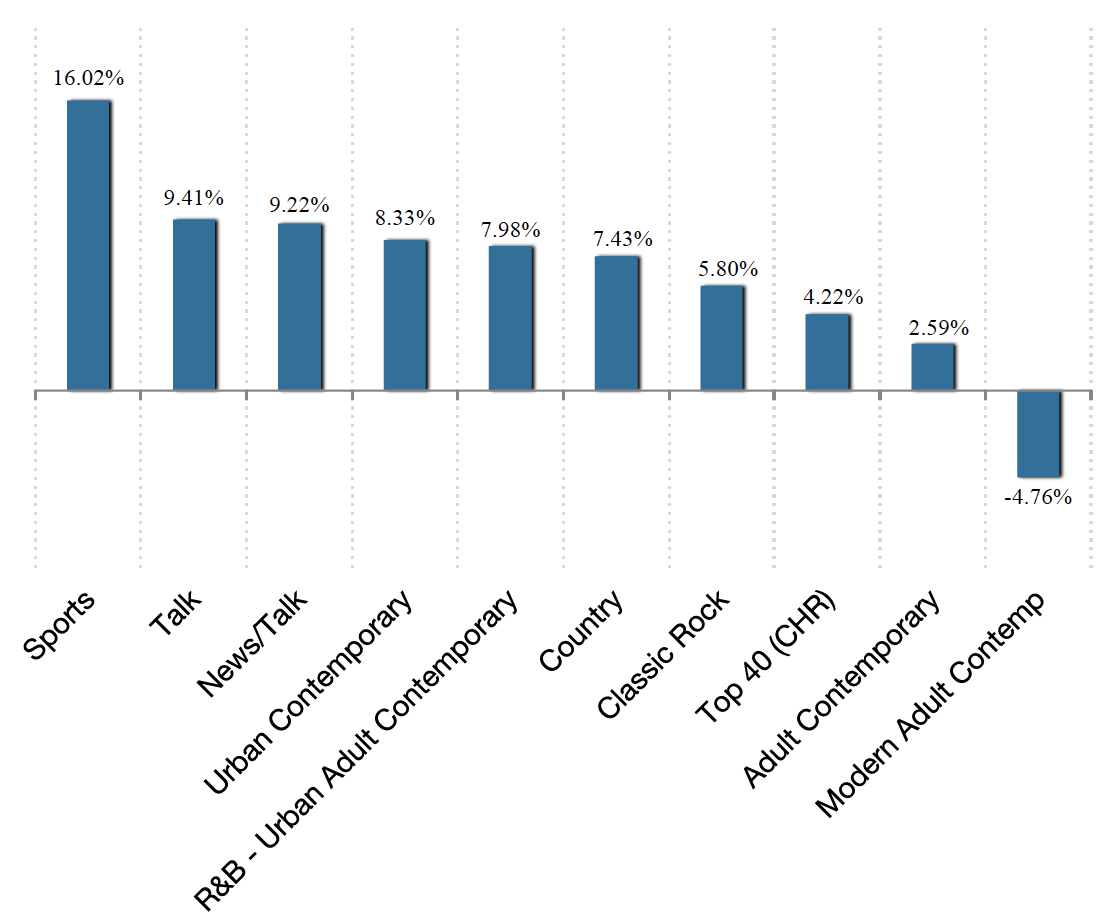
The Sports format shows the largest increase at 16 %
When compared to July 2017, the Sports format showed the largest increase at 16 % in AAS during the Monday through Friday 6am-7pm daypart.
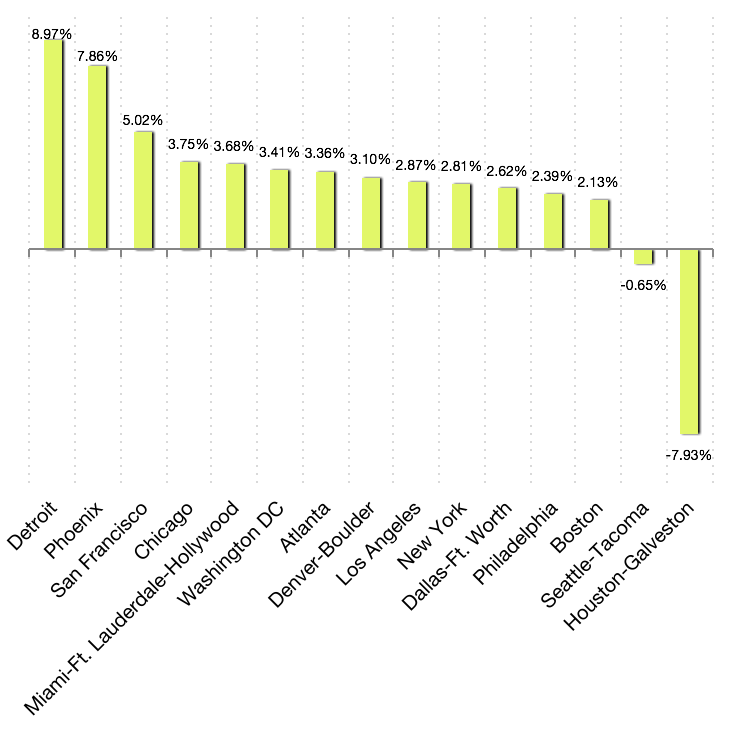
The Detroit market shows the largest increase at 9 %
Looking at the Top 15 markets as compared to July 2017, Detriot showed the largest listening increase at 9 % in AAS during the Monday through Friday 6am to 7pm daypart, followed by Phoenix.
{{cta('bd7af5f4-ff00-482b-862f-fb2d2e7409fc')}}
¿Está listo para desbloquear nuevos ingresos y simplificar la compra de anuncios?
Contáctenos